
# GodEye
[](http://cocoapods.org/pods/GodEye)
[](http://cocoapods.org/pods/GodEye)
[](http://cocoapods.org/pods/GodEye)
[](https://github.com/Carthage/Carthage)
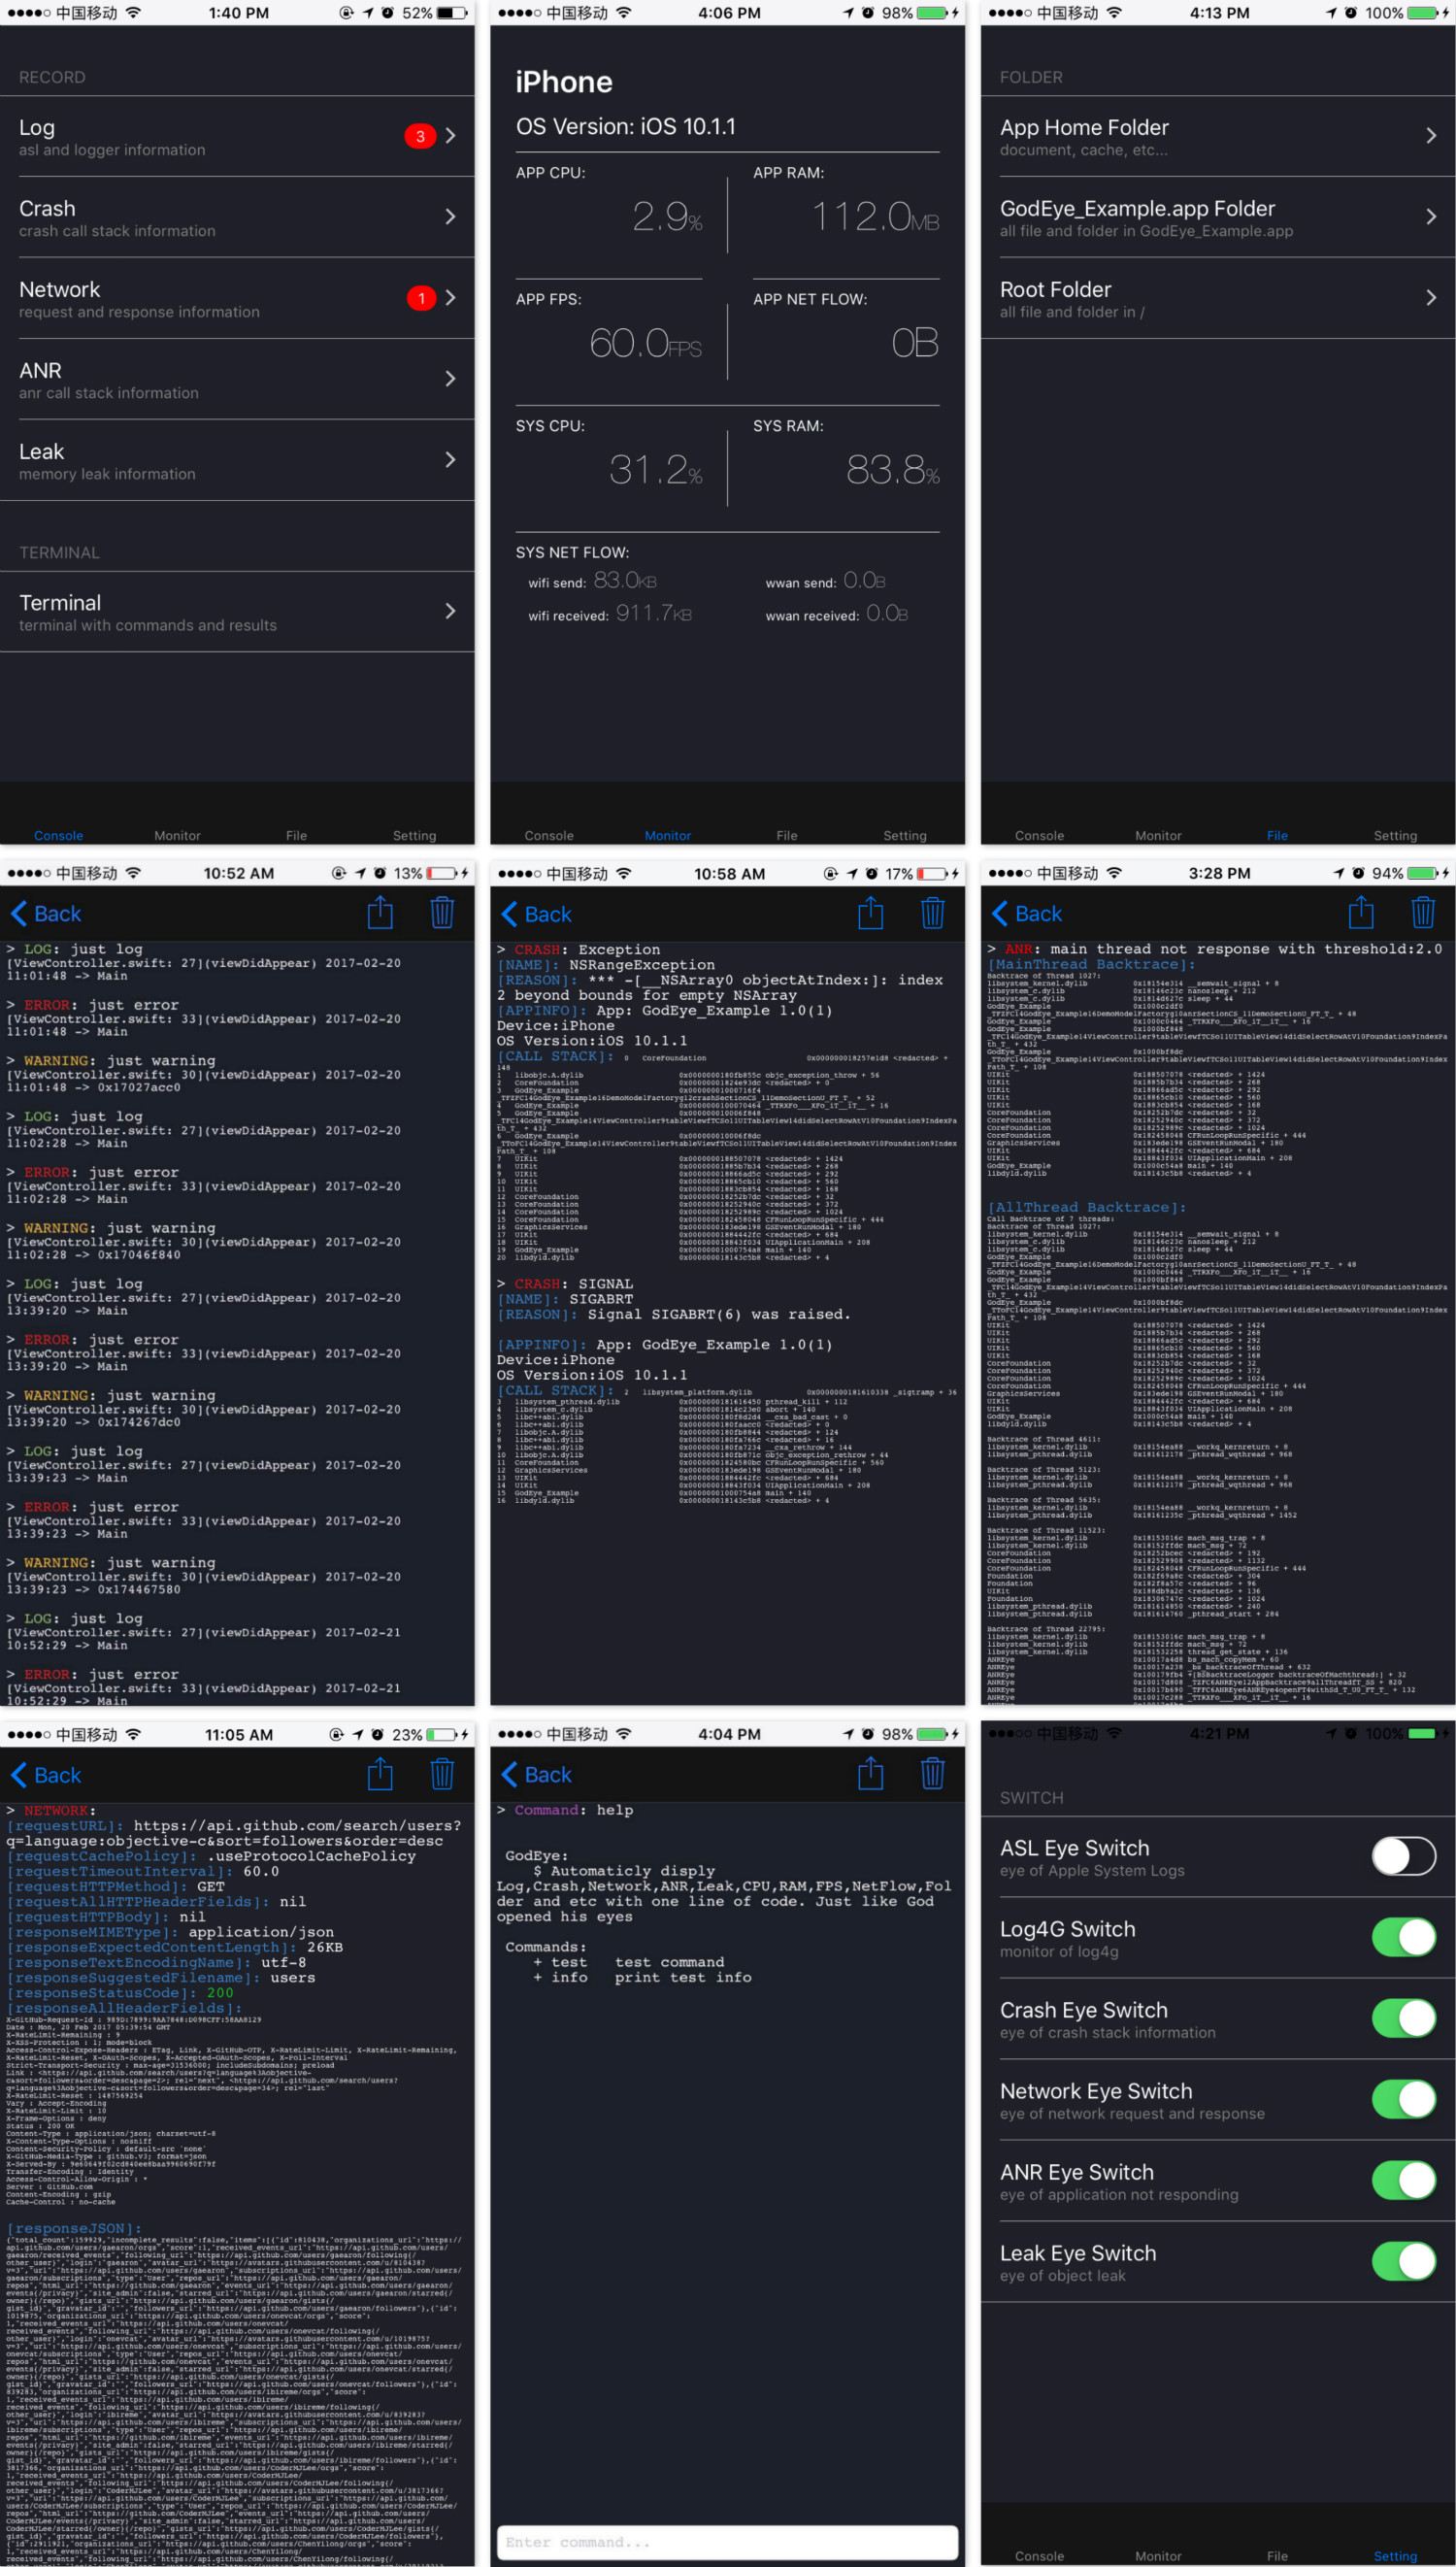
Automaticly display Log,Crash,Network,ANR,Leak,CPU,RAM,FPS,NetFlow,Folder and etc with one line of code based on Swift. Just like God opened his eyes.
**[ENGLISH README](./README.md)**
为了尽量复用代码,这个项目中的某些组件之间有比较强的依赖关系。为了方便其他开发者使用,我从中拆分出以下独立组件:
* [Log4G](https://github.com/zixun/Log4G) — Simple, lightweight logging framework written in Swift.
* [AssistiveButton](https://github.com/zixun/AssistiveButton) — Simple Assistive Button.
* [AppBaseKit](https://github.com/zixun/AppBaseKit) — A handy kit of Swift extensions and wrapped class to boost your productivity.
* [AppSwizzle](https://github.com/zixun/AppSwizzle) — lightweight and flexible method swizzling wrapped by swift.
* [LeakEye](https://github.com/zixun/LeakEye) — LeakEye is a memory leak monitor.
* [NetworkEye](https://github.com/zixun/NetworkEye) — NetworkEye is a network monitor,automatic catch the request and response infomation of all kinds of request send.
* [ANREye](https://github.com/zixun/ANREye) — ANREye is an ANR (Application Not Responding) monitor,automatic catch the ANR and return stacktrace of all threads.
* [ASLEye](https://github.com/zixun/ASLEye) — ASLEye is an ASL(Apple System Log) monitor, automatic catch the log from NSLog by asl module.
* [CrashEye](https://github.com/zixun/CrashEye) — CrashEye is an ios crash monitor,automatic catch exception crash & signal crash and return the stacktrace.
* [SystemEye](https://github.com/zixun/SystemEye) — SystemEye is a system monitor,automatic catch the infomation of cpu,memory....etc.
## 功能
- [x] 监控日志并区分日志类型.
- [x] 监控崩溃, 包括Uncatched Exception和Signal崩溃.
- [x] 监控网络, 包括请求和响应的所有信息.
- [x] 监控卡顿, 并告诉你卡顿时候的所有线程的堆栈.
- [x] 监控内存泄露, 告诉你泄露的对象的类名.
- [x] 提供一个可以自定义指令和输出的控制台.
- [x] 监控系统和应用自身的CPU使用率.
- [x] 监控系统与应用自身的内存使用率.
- [x] 监控帧率FPS.
- [x] 监控系统和应用自身的网络流量.
- [x] 提供一个文件浏览器可用于查看沙盒,.app 以及系统根目录的文件.
- [x] 运行时自定义设置
## 特点
- [x] 丰富: 功能全面
- [x] 方便: 一行代码接入
- [x] 自动: 零代码入侵
- [x] 安全: Release包可不打入一行代码
## 预览
 ## 书与原理
**笔者写了一本书,名叫[《iOS监控编程》](https://www.qingdan.us/product/25),每个章节记录了功能的实现细节,以及笔者一路探索的心路历程。当然,笔者后续依旧会寻求与探索新的监控方向,一旦有所得都会更新到本书的章节中.**
## 书与原理
**笔者写了一本书,名叫[《iOS监控编程》](https://www.qingdan.us/product/25),每个章节记录了功能的实现细节,以及笔者一路探索的心路历程。当然,笔者后续依旧会寻求与探索新的监控方向,一旦有所得都会更新到本书的章节中.**

## 安装
### CocoaPods
GodEye目前可以通过 [CocoaPods](http://cocoapods.org)来安装.只需要将下面的代码加入到你的Podfile中即可:
```ruby
pod "GodEye"
```
#### 在Release下不编译进一行代码
首先,在Podfile中添加configurations配置:
```ruby
pod 'GodEye', '~> 1.0.0', :configurations => ['Debug']
```
然后,在你的target的`Build Settings`中找到`Other Swift Flags`项,,在Debug scheme中添加 `DEBUG`.
最后,在初始化GodEye代码上添加`DEBUG`宏:
```swift
#if DEBUG
GodEye.makeEye(with: self.window!)
#endif
```
### Carthage
如果你使用 [Carthage](https://github.com/Carthage/Carthage)来集成, 在Cartfile添加GodEye:
```
github "zixun/GodEye"
```
#### Add GodEye to Embed Frameworks
拖拽Carthage/Build目录下的`GodEye.framework`到你应用的target的`“General”`设置面板中的`“Embed Frameworks”`栏中
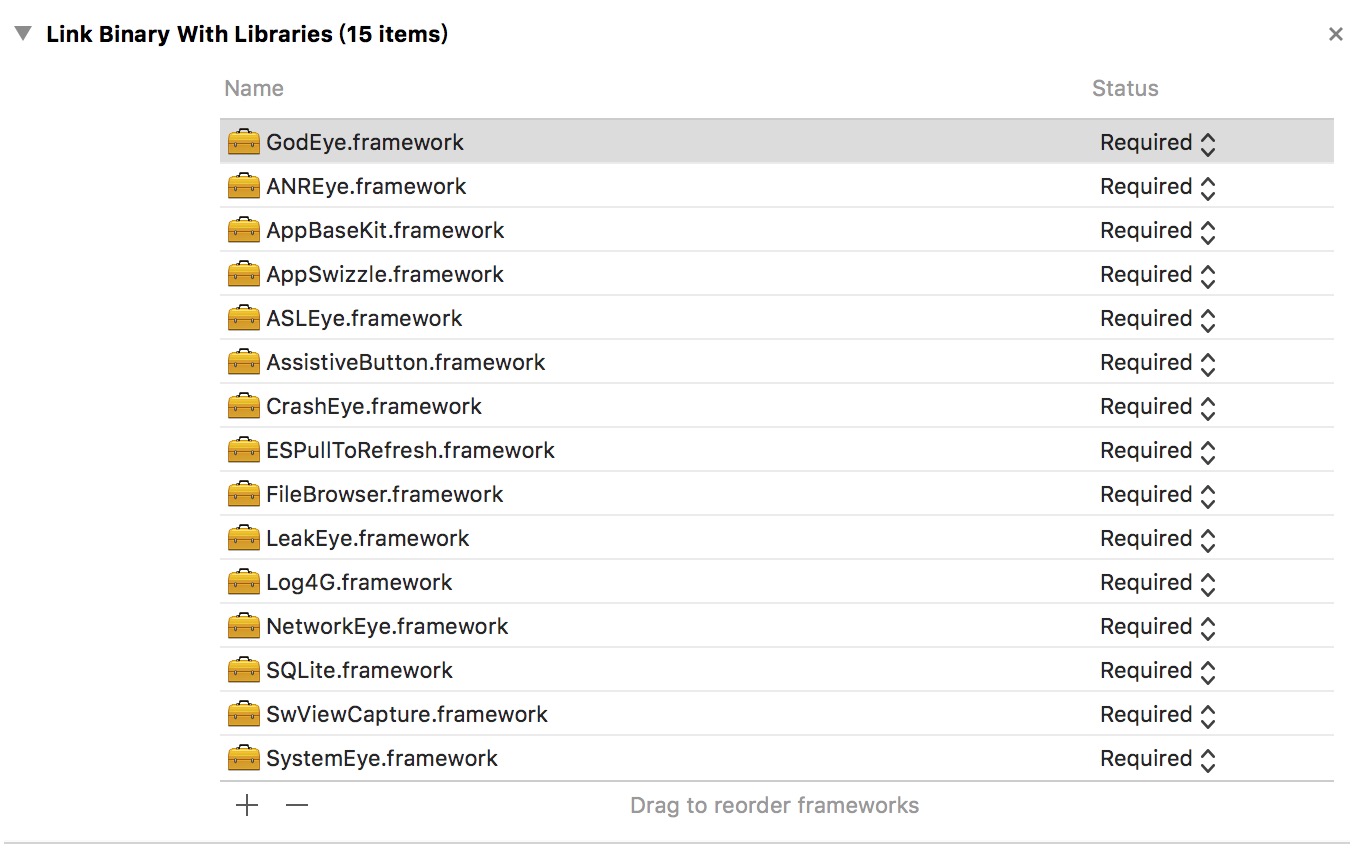
#### Add Dependency to Linked Frameworks and Libraries
拖拽Carthage/Build目录下的GodEye依赖的framework到你应用的target的`“General”`设置面板中的`“Linked Frameworks and Libraries”`栏中
#### Add Run Script
在你应用的target下的“Build Phases”设置面板中,点击“+”按钮,选择“New Run Script Phase”,新建一个Run Script,添加下面的内容到shell输入框中:
```
/usr/local/bin/carthage copy-frameworks
```
添加上面依赖的framework的路径到“Input Files”中:

## 在使用GodEye的开源App
[CocoaChinaPlus](https://github.com/zixun/CocoaChinaPlus)是一款用Swift编写的开源的CocoaChina第三方客户端,目前已经接入GodEye,并且可以很好的工作。
## 使用
在`AppDelegate`中用下面的代码导入进来:
```swift
import GodEye
```
然后在 `application:didFinishLaunchingWithOptions`初始化GodEye:
```ruby
GodEye.makeEye(with:self.window!)
```
当然,一行代码接入是一种默认配置的接入,读者也可以通过传入自己的`Configuration`来精细化配置各个细节:
```swift
let configuration = Configuration()
configuration.command.add(command: "test", description: "test command") { () -> (String) in
return "this is test command result"
}
configuration.command.add(command: "info", description: "print test info") { () -> (String) in
return "info"
}
GodEye.makeEye(with: self.window!, configuration: configuration)
```
上面的示例是自定义命令的配置,我们也可以自定义`control`和`switch`的配置,详细的配置项可以看`ControlConfiguration` 和 `SwitchConfiguration`两个类。
## 示例
clone这个库,在Example目录下运行`pod install`就可以跑工程自带的示例工程了。
## 作者
twitter: [@zixun_](https://twitter.com/zixun_)
email: chenyl.exe@gmail.com
github: [zixun](https://github.com/zixun)
blog: [子循(SubCycle)](http://zixun.github.io/)
## 感谢
首先需要感谢的是开源社区Github,它给了我很多思路和灵感,甚至现成的代码:
* 日志监控灵感源于AELog:[https://github.com/tadija/AELog](https://github.com/tadija/AELog);
* 崩溃监控灵感源于GT:[https://github.com/Tencent/GT](https://github.com/Tencent/GT);
* 卡顿监控灵感源于Watchdog:[https://github.com/wojteklu/Watchdog](https://github.com/wojteklu/Watchdog);
* 网络监控灵感源于NetworkEye:[https://github.com/coderyi/NetworkEye](https://github.com/coderyi/NetworkEye);
其次要感谢的是全球最大的技术问答社区StackOverFlow,它解答了笔者写作与开发中很多遇到的问题,以下列出几个映象深刻的:
* 应用的CPU使用率:[ios-get-cpu-usage-from-application](https://stackoverflow.com/questions/8223348/ios-get-cpu-usage-from-application);
* 系统的CPU使用率: [get-cpu-percent-usage](https://stackoverflow.com/questions/6785069/get-cpu-percent-usage)
然后要感谢的是几位大牛的博客:
* 内存泄漏灵感源于MrPeak的PLeakSniffer:[http://mrpeak.cn/blog/leak](http://mrpeak.cn/blog/leak)
* 微信阅读团队MLeaksFinder:[https://wereadteam.github.io/2016/02/22/MLeaksFinder](https://wereadteam.github.io/2016/02/22/MLeaksFinder)
## 开源协议
GodEye开源在 MIT 协议下,详细请查看 LICENSE 文件。